Public Safety at IIT
Problem Statement and Importance
The business problem that we are trying to solve using the project is: “Determine locations for deployment of public safety measures to effectively reduce incidents rates on campus and the surrounding areas”. The importance of solving the business problem could be listed as follows :
- Identification of zones/sectors of serious incidents will enable public safety department to effectively deploy their forces
- The surrounding areas with higher chances of incidents should be brought under surveillance to ensure the safety of students residing in these areas.
- Effectively bring down the crime rates happening within and around the campus to improve the “safety” aspect of the university and thereby attract potential students across the globe.
Plan of Action
The following plan of action was formulated for carrying out the project execution :
- Collect records of incidents that happened within and surrounding areas of campus within two blocks for time period of 2015 - 2017
- Collect historical weather data for the incident locations for the time period
- Getting the latitudes and longitude information for the incident address
- Data munging for removing empty values, correcting errors, standardizing incident types and preparing dataset in standardized format in chronological order
- Exploratory Data analysis of the features present in the dataset
- Segregating the incident types into two classes based on Severity and build Classification model
- Train the model on 2015 - 2017 training data, and test the model accuracy and results using the recent crime data
- Create a prediction app that maps 1- Day, 3-Day and 5-Day prediction of incidents and depict the crime hotspots in IIT Campus area
Datasets Used
The datasets that we have used for basing the results of our studies are the following :
- IIT Public Safety Crime logs for the incident records of the campus from 2015 - 2017.
- Chicago Crime data portal is used as source of incidents in the surrounding area (within two mile grid) for the same time period
- Underground Weather API for extracting the historical weather data.
- Google API for getting Latitude and Longitude information
- Google Maps for getting the location map of IIT Area
Web-Scraping
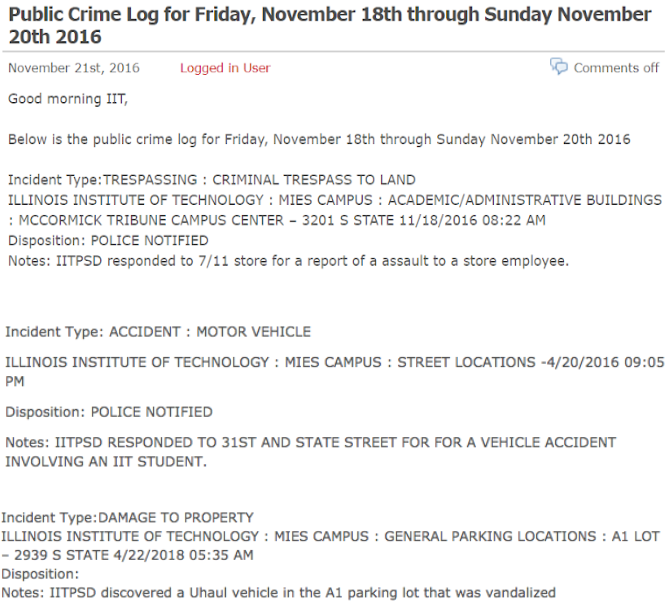
First, we’ve found out whether we need special permission to web-scrape data from IIT Public Safety Blog, and there were no limitations for that at the time of communication. Second, we need to examine the structure we are going to web-scrape. Incidents that occur at IIT campus are published in form of blog posts, available here. Each post can have several incidents reported or message that there are no incidents to report.
All the archive incidents are stored by months and can be accessed from web or by adding year and month in the numerical form separated by ‘/’, for example, to view incidents for January 2015 the link will be the following:
https://blogs.iit.edu/public_safety/2015/01/
Also, if all the incidents for the selected month don’t fit on one page, there will be several pages for the month which can be accessed by adding ‘/page/2’, where ‘2’ is page number:
https://blogs.iit.edu/public_safety/2015/01/page/2/
Another thing we need to identify is how posts are stored on a web-page. In our case each post is stored in element of class ‘content’, which we are going to extract from web-pages for each month we are analyzing.
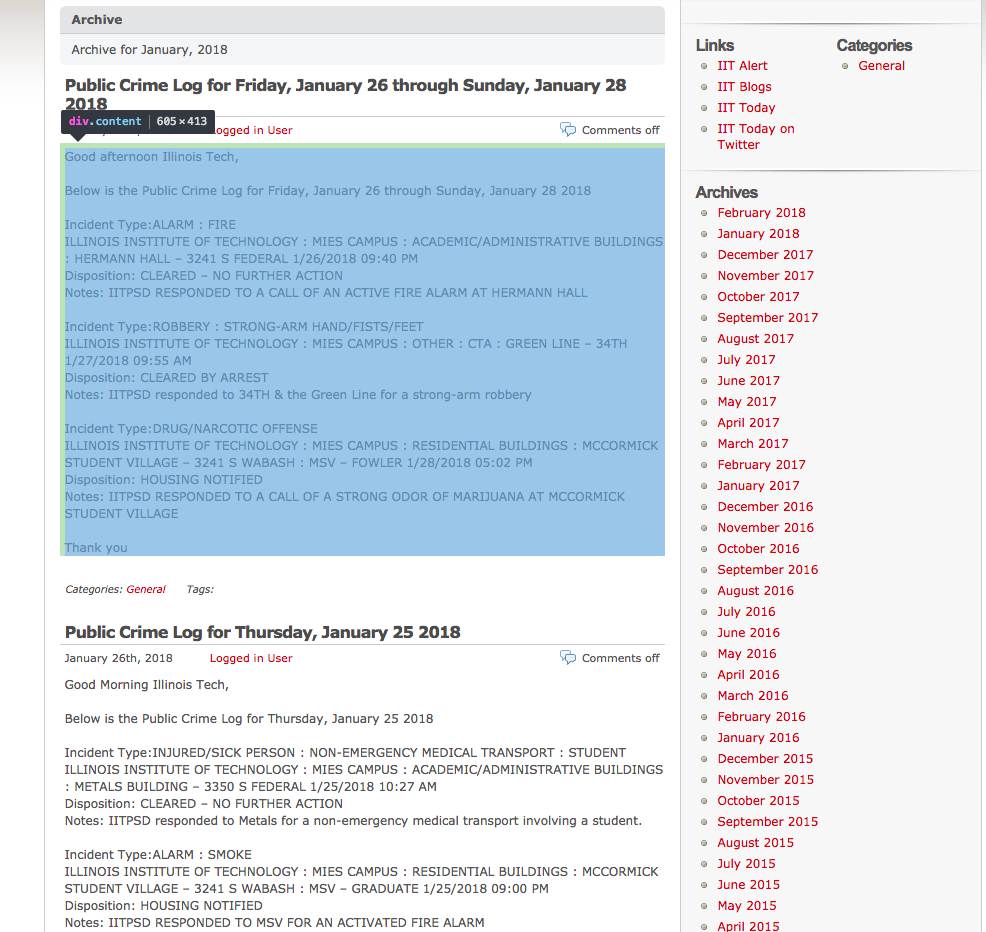
And the last thing we need to identify how each post will be splitted into parts. We will extract:
- Incident type
- Location
- Date occurred
- Disposition
- Notes
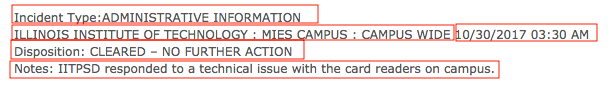
Note that posts are inconsistent in formatting and information given, for example, in the earlier posts there will be no ‘Disposition’ information. In addition to that, location information part starts with ‘ILLINOIS INSTITUTE OF TECHNOLOGY’, which is not explicitly saying us that all posts location information will start from that. So, in the extraction process, we’ve also used an approach, when we’ve first extracted location+date (‘ILLINOIS INSTITUTE OF TECHNOLOGY : MIES CAMPUS : CAMPUS WIDE 10/30/2017 03:30 AM’) and then by subtracting date of occurence obtained the location.
Weather Data
We found many different weather data candidates for past data, however many of them came at some cost. We determined that the best weather API to use was Underground Weather. They did have plans that were available for purchase, but they also allowed free access as long as we stay under 500 calls per day and 10 calls per minute. One of the deciding factors for using Underground Weather’s API is that they have created an R package to easily make calls to the API. The package is called ‘rwunderground’. In order to get this package, you must use devtools and install from github with the command:
*devtools::install_github('ALShum/rwunderground')*
You can then use commands within the package to set the key, set the location, and get the historical data given the key, location, start date, and end date. Since we had obtained a free key, we could only call the API 500 times a day. Because of this, we made sure the set the start date and end date so that there are only 500 days in between. This meant that in order to get all of the data that we wanted for the 3 years, we needed to run this code on 3 separate days and then merge the data. The history function to get the historical data had a convenient argument that limits the calls to 10 per minute so that we do not go over the free limit. We also monitored to total calls per day to ensure that we did not go over the total calls in a day. Also, since we had to do this over three days, the datasets were obtained and saved manually each day. The readme for the rwunderground package supplied easy instructions for how to make calls to the API.
Crime Portal Data
The crime data for the surrounding areas of IIT (Kent and Meis) was obtained from the Chicago Data Portal. The bounds was a 2 mile grid centered at the Mies Campus and a 1 mile grid centered at Kent Campus. The latitude bounds were 41.8603, 41.8025 longitude bounds were -87.66687, -87.58759 for Meis campus, and, latitude bounds were 41.89363, 41.86465 and longitude bounds were -87.66203, -87.62239 for Kent campus. Using these bounds all the data from 2015 onwards was pulled from the crime data portal to incorporate it into further steps including EDA and the prediction model.
Data Preparation and Munging
Web-scraping data (get_web_data.R)
We will follow the steps below to extract data from IIT Public Safety blog:
-
Set the time frame for incidents we are going to web-scrape (some incidents may be posted with 2-3 days delay). We are web-scraping incidents from ‘2015-01-01’ to ‘2018-01-01’.
- Obtain links for the time frame set (without pages, yet):
#[1] "https://blogs.iit.edu/public_safety/2015/01/" "https://blogs.iit.edu/public_safety/2015/02/" #[3] "https://blogs.iit.edu/public_safety/2015/03/" "https://blogs.iit.edu/public_safety/2015/04/" #[5] "https://blogs.iit.edu/public_safety/2015/05/" "https://blogs.iit.edu/public_safety/2015/06/" - Obtain all additional pages that exist for the links for time frame:
"https://blogs.iit.edu/public_safety/2015/01/" "https://blogs.iit.edu/public_safety/2015/01/page/2/" "https://blogs.iit.edu/public_safety/2015/01/page/3/" "https://blogs.iit.edu/public_safety/2015/02/" "https://blogs.iit.edu/public_safety/2015/02/page/2/" "https://blogs.iit.edu/public_safety/2015/03/" - Extract all the posts for the time frame for all links (one element (string) can have multiple posts):
#[[86]] #[1] "\n\t\t\t\t\t" #[2] "\r\n\t\t\tthere is no information to report for the iitpsd public crime log for 1-8-2018.\n\t\t\t\r\n\t\t" #[3] "\r\n\t\t\tgood morning and welcome back illinois tech!\nbelow is the public crime log for friday, january 5 thought sunday january 7 2018\nincident type:harassment : phone\nillinois institute of technology : kent campus – 565 w adams 1/5/2018 10:33 am\ndisposition: information only\nnotes: iitpsd responded to a phone harassment call.\n\nincident type:alarm : fire\nillinois institute of technology : vandercook 2 – 3125 s federal 1/5/2018 05:00 pm\ndisposition: facilities notified\nnotes: iitpsd responded to a call of an actived fire alarm at vandercook #2.\nincident type:assault-aggravated\nillinois institute of technology : vandercook 2 – 3125 s federal 1/6/2018 11:40 pm\ndisposition: cleared by arrest\nnotes: iitpsd responded to 31st and federal for a wellbeing check of a member of general public.\nincident type:utility incident : water\nillinois institute of technology : \mies campus : academic/administrative buildings : siegel hall – 3301 s dearborn 1/7/2018 04:36 pm\ndisposition: housekeeping notified\nnotes: iitpsd responded to siegel hall for a utility incident involving water.\nthank you\n\n\t\t\t\r\n\t\t" -
At this point we will obtain number of incidents for the timeframe to check if it matches with number of incidents obtained for analysis.
- Split the extracted content to singular posts:
#[997] "incident type:assist other agency/department\nillinois institute of technology : mies campus : street locations : state-2/5/2016 08:30 pm\ndisposition: police notified\nnotes: iitpsd responded to 31st and state street for a report of shots fired in the area involving members of the general public.\n \nthank you,\n \n\t\t\t\r\n\t\t" #[998] "\r\n\t\t\thello,\n \nthere is no information to report for the iitpsd public crime log for 2/4/2016.\n \nthank you,\n \n\t\t\t\r\n\t\t" - Take the vector of posts, extract data and puts in a dataframe, removing NA’s:
-
In the final steps of web-scraping, remove white spaces at start and end of values, remove escape characters, characters from the set [-,–,:] at the end of string and convert date of occurrence to POSIXct format.
-
Check if number of incidents obtained in point 5 above match number of incidents in the dataframe of all incidents. For the 3-years period, we’ve obtained 1604 incidents.
-
Save dataframe as .rda for further processing
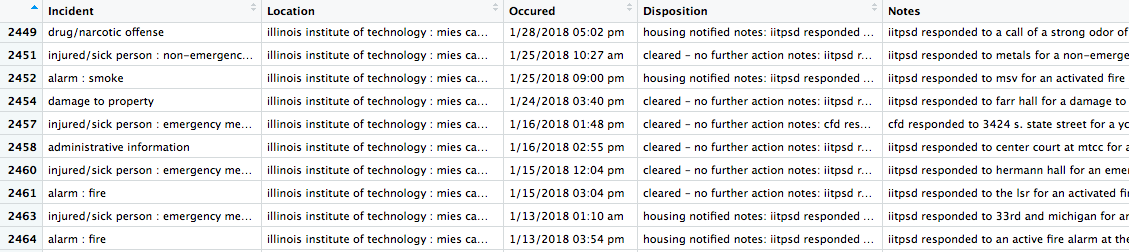
As an output of the web-scraping step, we’ve obtained a data frame of incidents with the following columns:
- Incident
- Location
- Occurred
- Disposition
- Notes
Getting address for location (iitCrime_getAddress.R)
Once we’ve looked through the obtained incident’s location information, we’ve realized, that not all incidents have the exact address, but can have an IIT Campus building name as a way to specify incident location:
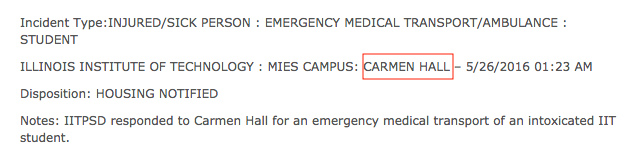
Or even abbreviated name, like ‘mtcc’ for ‘McCormick Tribune Campus Center’. For such cases we’ve built a dictionary (iit_dict_buildings.csv) of all IIT Buildings and abbreviated names with corresponding addresses.
Some of the incident reports have the location specified in informal way, for instance:
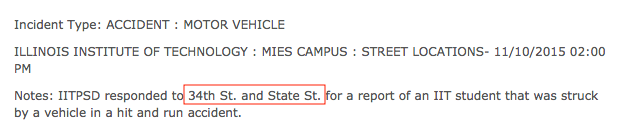
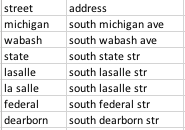
Such information can not be used straight away to determine incident’s latitude and longitude, As we consider incidents on campus and surrounding area, we’ve built a dictionary of streets (iit_dict_ns_streets.csv), that go through our area of analysis from north to south (Michigan, State, Wabash etc) with ‘South’ add-on.
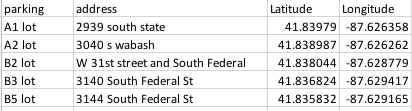
Third major group of incidents without exact address are incidents occurred at parking lots, that are specified as:
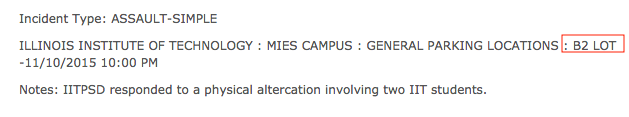
For such reports, will be using a dictionary of parking lots, but for parking lots (iit_dict_parkings.csv) we will return latitude and longitude straight away pointing at the center of parking lot, otherwise in case of using address, we will get an intersection of two streets near the parking lot, which is misleading for our analysis.
We’ve also included two CTA stations in this dictionary - ‘red line and 35th’ and ‘green line and 35th/34th’.
We will follow the steps below to obtain exact address for the location specified by Public Safety officers:
- Load data we’ve web-scraped with get_web_data.R
- Load dictionaries of IIT buildings, parking lots and streets (‘iit_dict_buildings.csv’, ‘iit_dict_parkings.csv’, ‘iit_dict_ns_streets.csv’).
- Make sure that we don’t have multiple space between words and both ends in location and notes columns we will be working with.
- Convert dictionaries records to lower case.
- Add new columns to the data frame of incidents: “Address”, “Latitude”, “Longitude”
- Apply IIT buildings dictionary to location column to obtain exact address. We’ve managed to get an address for 1038 of 1604 observations.
- Apply IIT parking lots dictionary to location column to obtain latitude and longitude. We’ve managed to get an address/or location for 1127 of 1604 observations.
- Apply IIT buildings to notes column to obtain exact address. We’ve managed to get an address for 1252 of 1604 observations.
- Apply IIT parking lots dictionary to notes column to obtain latitude and longitude. We’ve managed to get an address/or location for 1258 of 1604 observations.
- Search for address in location with regex, for example, search for address of type ‘3424 s michigan’, replace ‘s’ with ‘south’ and add address value for instances with empty address. We’ve managed to get an address for 1322 of 1604 observations.
- Search for intersections of streets in location and notes columns with IIT streets dictionary. We’ve managed to get an address for 1428 of 1604 observations.
- Save dataframe as .rda for further processing.
Standardization of Incidents
From the extracted data of IIT-logs the incident type in many cases was not the actual incident type. For instance, the incident type may be logged as Trespassing, however, going through the Notes attribute of the log it is clear that it was an Assault.
To fix the problem text analysis was performed by identifying observations that contained key words associated to a particular incident type. For instance, cluster of words “medical”, “injury”, “slip”, “emergency”, “transport”, “injur” and “fainted” were tagged as “MEDICAL INCIDENT”. Below is the cluster words associated with the different incident types,
"marijuana", "narcotic", "drug" => “NARCOTICS”
"robb" => “ROBBERY”
"alarm", "smoke", "fire" => “ALARM”
"assault" => “ASSAULT”
"battery" => “BATTERY”
"theft","stolen","burglary","larceny" => “THEFT”
"water","power","utility","elevator","entrapment","surge","electricity","gas"=>“UTILITY INCIDENT”
"well", "check", "friend", "worried" => “WELL BEING CHECK”
"disturbance", "noise", "complaint","disorderly","hazing" => "DISTURBANCE"
"accident", "vehicle", "hit and run" => "ACCIDENT"
"damage", "property", "vandal","window" => "DAMAGE TO PROPERTY"
"trespass","enter" => "TRESPASS"
"alcohol","liquor" => “LIQUOR LAW VIOLATION”
"suspicious" => "SUSPICION"
Once this was completed the remaining records which had not been associated with any word clusters were assigning to new types such as “HOMICIDE”, “MISSING PERSON”, “OTHER”, “SEXUAL CRIME”, “STALKING”, “WEAPON”.
Chicago Data Portal
For the final dataset to have identical incident type classification the crime data from the Chicago Data Portal was standardized by using merge operation. First a dictionary was created for the unique incident types in the crime data to be matched, merge_IIT_Crime.xlsx for Meis and merge_IITKent_Crime for Kent campuses. The merge operation was then performed resulting in a new column with Standardized incidents.
Reclassification of Incidents:
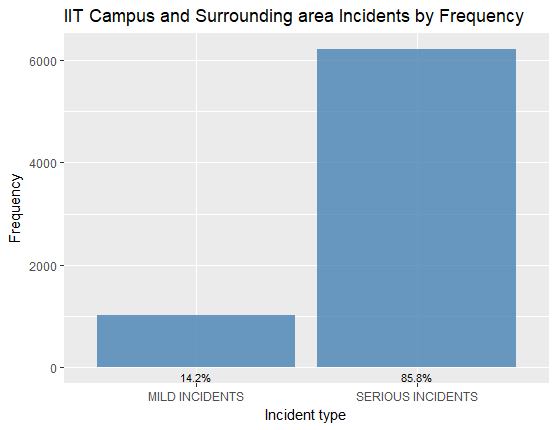
Once this standardization was performed the incidents were reclassified into two broad categories, “MILD INCIDENT” and “SERIOUS INCIDENT”. Serious incident were chosen as the incidents where there is an immediate threat to life/valuables. Mild incidents on the other hand were classified on the basis that there was no immediate threat to life by another person by another person.
Standardization of Time and Date:
The date and time for both Crime Data Portal and IIT Incident log datasets were not identical. They were all converted into Posixct time with tz as America/Chicago. When data was being converted to this format, the values of the time had changed i.e. the time in the actual incident report log did not match the time in our dataset. This was because the time was being read as tz = “Europe/London”. Thus 5 hours(without daylight savings) needed to be added before converting to tz = “America/Chicago”.
Cleaning and Standardization of Weather Data:
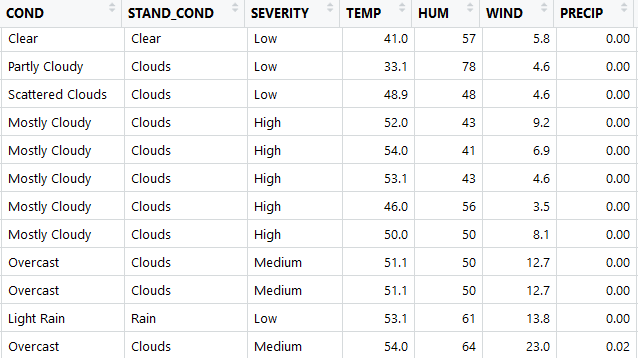
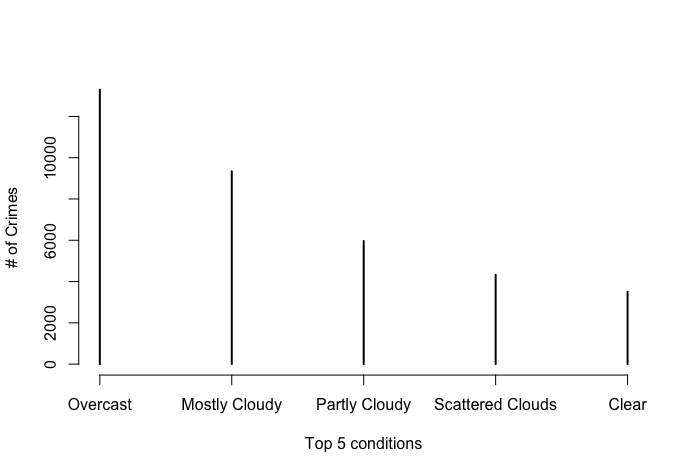
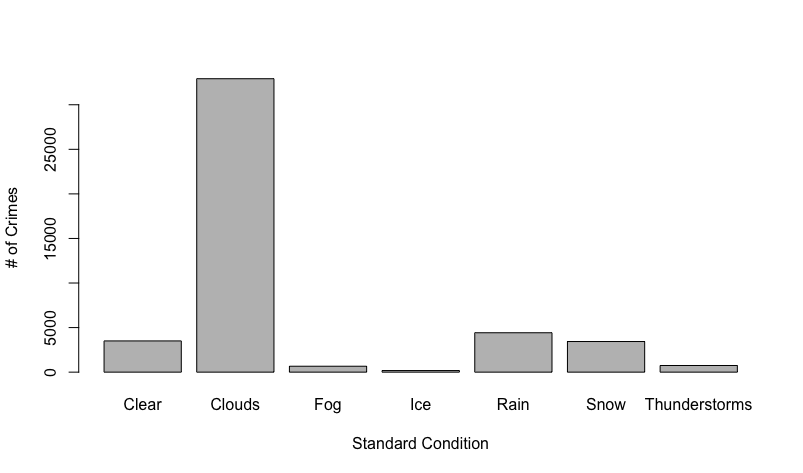
The weather dataset that we obtained had 21 attributes. 6 of these attributes had more than half missing values, while 2 of those were missing all of the values, we discarded these attributes. There were then about 6 out of 46,000 missing values, so we discarded these records from the dataset since there were so few. The other issue we found with the weather data is that the condition attribute had 37 different factors, and many of these were redundant. As seen in the figure below, there are conditions scattered clouds, partly cloudy, and mostly cloudy. In order to reduce the factors, we created 7 buckets labeled clear, clouds, fog, ice, rain, snow, and thunderstorms. The conditions typically come with descriptive before the condition as seen below. In order to try to not lose any information, we also created another set of 3 buckets for the descriptive words labeled low, medium, and high for the severity of the current condition. The problem with these buckets is that it was based solely on the severity of the description word and not on the condition with the descriptive word. For example mostly cloudy will be bucketed as high severity because of the word ‘mostly’, but this does not mean that the weather itself is severe in a dangerous sense. Because of this we should not use Severity in our analysis because they cannot be compared across different conditions.
Feature Extraction:
Weather Data:
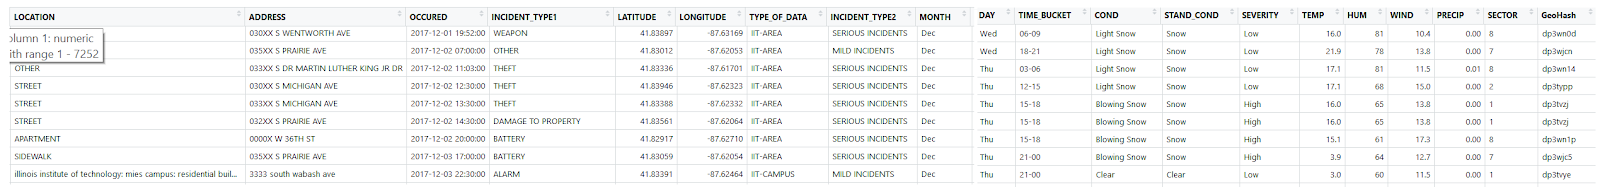
After cleaning the weather data, we needed to merge the weather data with the crime data based on date and time. We decided that we did not need to merge the entire weather dataset with the crime data. The attributes of weather that we chose to merge were condition, standardized condition, severity, temperature, humidity and wind. We did add both the original condition label as well as the bucketed condition to see which would give better results. The problem with merging the data sets is that the weather data is taken at discrete random time intervals (typically every hour). This meant that we could not join directly because the time in the crime data and weather data may not match up. We determined that the best estimate for the weather at the exact time of the crime is the closest weather condition in time. We used manhattan distance between the times of the crimes and the times of the weather. Our implementation of this used a nested for loop with the crime data set being the outside for loop. We take the current date/time of the crime and calculate the closest weather record. If there are two weather records of the same distance, the first weather condition was used and we merged it with the crime data set.
Day, Month, Time-Bucket
The day, month, time-bucket were extracted from the standardized date.
Latitude, Longitude, Sector and GeoHash
From the address column, the latitude and longitude were extracted using the google API. Care was taken to ensure the latitude and longitude values that were beyond the bounds of our analysis (2 mile grid and 1 mile grid for Meis and Kent respectively) were converted to NA values. All NA values were then removed. The parking lot latitude and longitude were directly used as extraction of Latitude and Longitude from google API of the address for parking lot gave the values of the intersection rather than the actual point.
Once the Latitude and Longitude were extracted, sectors were created by equally dividing the bound on latitude, i.e., 41.8276 and 41.8421, into 4 equal parts and the bound on longitude i.e., -87.6330 and -87.6170, into 2 equal parts. A total of 8 sectors were thus created.
Geohashing is used for aggregating the latitude and longitude value in to a single hash value with the required precision. In this instance, we have used precision ‘7’ to hash all the latitude and longitude details of the incidents, and is treated as a factor variable with 133 levels.
Consolidation of Datasets
The IIT Incident log data, Crime Portal data, Weather Data were combined with the following columns:
Exploratory Data Analysis
There was a class imbalance between Mild Incidents and Serious Incidents:
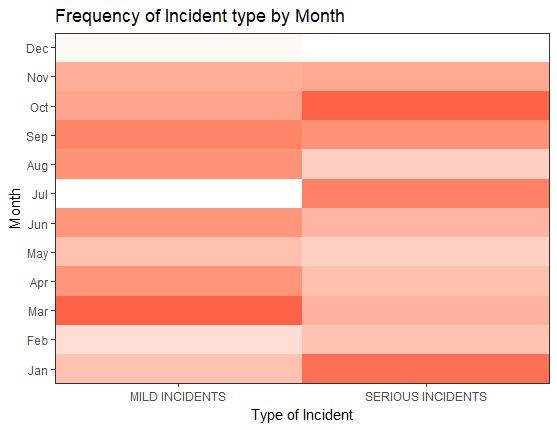
Distribution of incidents across month of the year indicated that there were relatively low number of reported incidents in December and July, as it was Christmas Vacation and Summer Break:
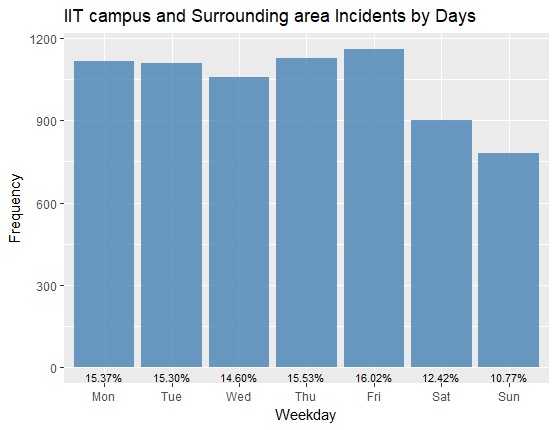
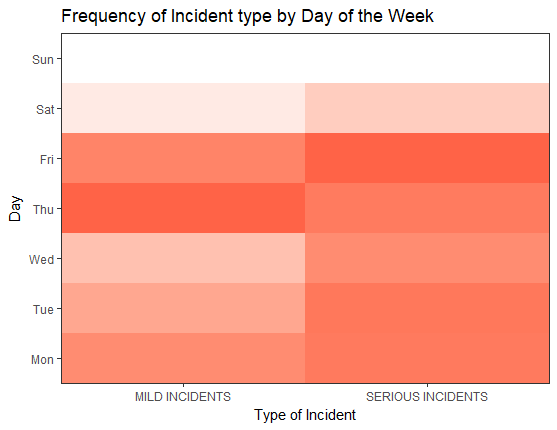
Distribution of Incidents across the days of the week feature showed there was slightly lower incidents reported on weekends:
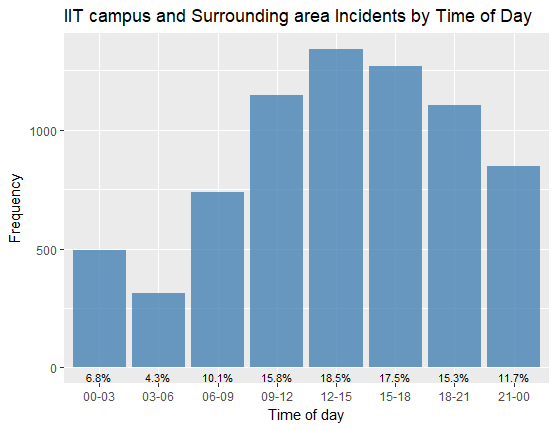
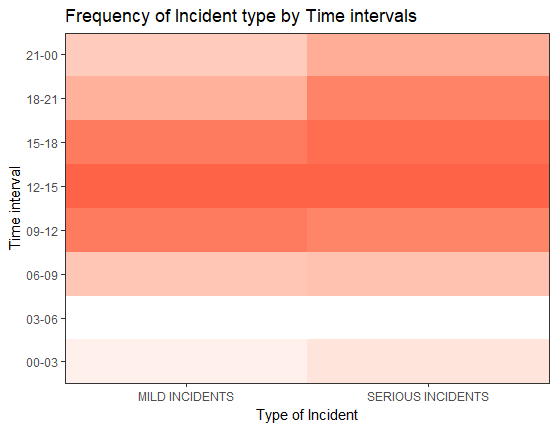
Distribution of Incidents across the time buckets showed lower Incidents reported in 3:00 AM to 6:00 AM:
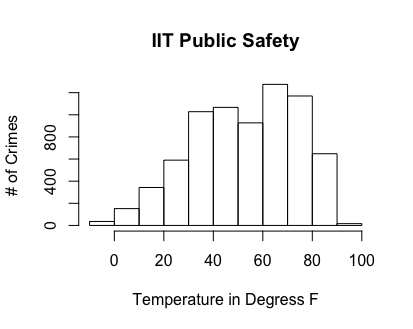
Below are the histogram plots for weather conditions with number of incidents. The first plot from the left shows the top 5 original conditions and their frequency. The next shows the frequency after we bucketed the conditions. The last plot is a histogram for the temperature in degrees Fahrenheit:
Predictive model
In order to answer the question of where to send a public safety officer to prevent a crime, we built many different prediction models that will predict the probability of a serious incident happening, given a date, time, and location. The prediction model will predict that a serious incident will happen if the probability is above .5 and a mild incident will happen if the probability is below .5. Mild incidents cannot typically be prevented, so we treated them as a serious incident not happening. In order to test our models, we trained the models on the first 80% of data by date and then tested on the later 20% of data. We split by date because we are trying to predict in the future, and this is a good way to simulate and test predicting in the future. We used 4 different modeling techniques to try to predict serious incidents: Naive Bayes, Decision Trees, Random Forests, and Logistic Regression. The results of the models are listed below.
| Model | No Information Rate | Accuracy | Sensitivity | Specificity |
|---|---|---|---|---|
| Decision Trees | .85 | .88 | .46 | .95 |
| Random Forests | .85 | .85 | 0 | 1.00 |
| Naive Bayes | .85 | .85 | 0 | 1.00 |
| Logistic Regression | .85 | .88 | .46 | .95 |
From this table, it can be easily seen that logistic regression is the only model that did not predict all serious incidents and have accuracy the same and no information rate. This is because we have so many serious incidents in comparison to mild incidents that the models want to always predict serious. This is impractical however because not all mild incidents will be reported and there are a limited number of public safety officers, so we cannot tell them to go everywhere, always. In order to fix this problem, we used the package ROSE. This package allowed us to synthetically sample from our data in order to balance out the mild and serious incidents. We could then train our models on this data and test it on the original test data so that the models predict mild more often and not serious all the time. With the Rose package we got the following results:
| Model | No Information Rate | Accuracy | Sensitivity | Specificity |
|---|---|---|---|---|
| Decision Trees | .85 | .80 | .70 | .80 |
| Random Forests | .85 | .63 | .42 | .66 |
| Naive Bayes | .85 | .79 | .71 | .80 |
| Logistic Regression | .85 | .80 | .69 | .81 |
While our accuracy has fallen, we are getting models that are more realistic and will predict more specific areas that have a larger probability of a serious crime happening. We ended up deciding to choose the logistic regression model trained on the rose data as our model to predict serious crimes because it has one of the highest accuracies and it has the highest specificity. In order to deploy this model, we gave it a location, date, and time and it would give us a probability, we could then use this probability to create a heat map to show public safety officers.
Challenges Faced
- Unstructured data from the IIT crime logs
- Ambiguous/incorrect classification of incident types
- Location Description instead of address
- Limit to calls in Weather and Google address API
- Redundant information from weather API
- Imbalance in Crime classes in IIT Area and Campus data
Deployment
The application’s goal is to provide a self-explanatory visual representation of incident’s hotspots on campus based on historical data and for prediction of incidents.
Historical incidents map can be used to analyze the hotspot’s locations and how they change through the time in order to make informed decisions in terms of incidents prevention and increase awareness of students which areas should be avoided.
Prediction of incidents provides potential incident’s hotspots for 1, 3 and 5 days from the current date. Based on that information a recommendation to spend more time in the hotspot area during the shift could be given to a public safety officer.
Application features (app.r)
Working area splitted into side panel on the left, where user applies filters and display area to the right for visual representations with two tabs to view map with prediction and tab with historical data. In the future version, side panel will be splitted to separate filters that are applicable to prediction from filters used in historical representation. Currently, filters in the green box used when working with incident prediction, blue box filters when plotting hotspots based on historical data.
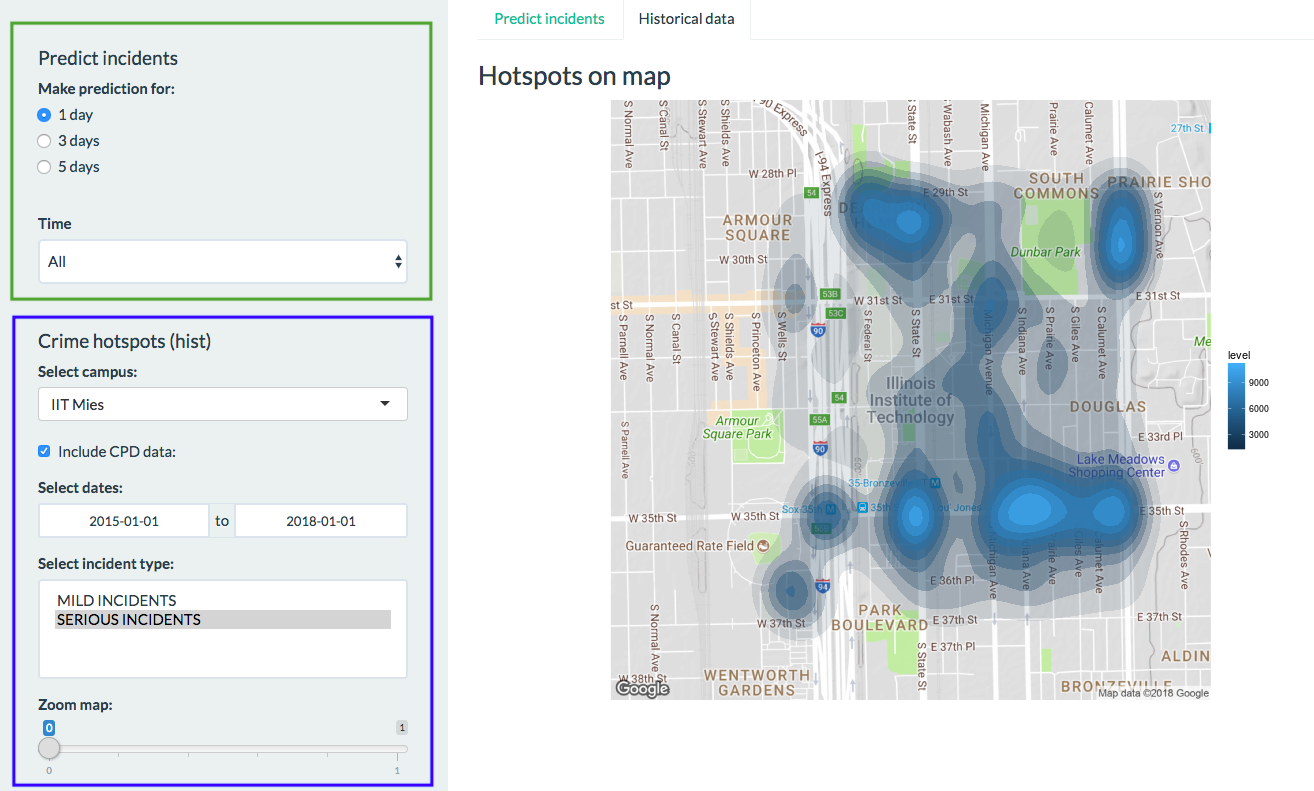
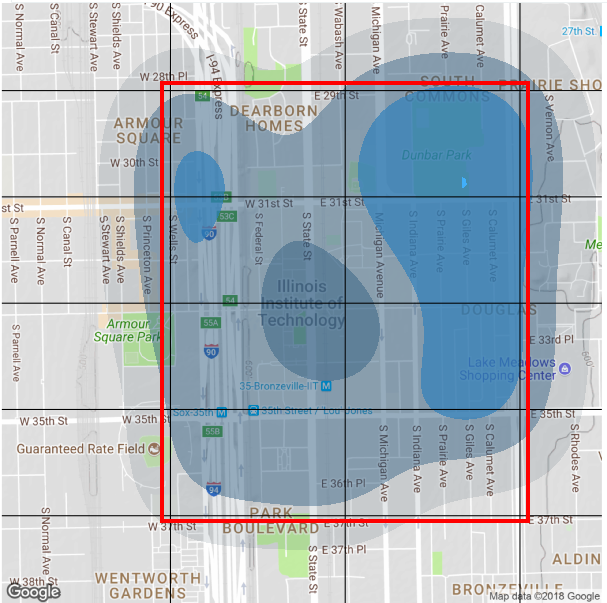
To view predictions, we choose ‘Predict Incidents’ tab, choose for what period of time to do a prediction (1,3 or 5 days). Also, user may apply a time filter, to view prediction for the specific time frame during the day, for instance, from 12 to 15. That can be useful to understand which areas need more public safety resources during the day. Additionally, IIT campus area is splitted into 8 sectors, so that public safety patrols can easily split their zones of responsibility. All sectors are shown in red box below.
To view incident hotspots based on historical data, we choose tab ‘historical data’ and can apply the following filters:
- Select campus (IIT MIES or IIT KENT)
- ‘Include CPD (Chicago Police Department) data’ or use only IIT Public Safety incidents reports
- Set timeframe
- Select incident types to plot (multiple selection)
- Zoom in and out
Current limitations:
- Static maps. Dynamic maps planned for the next version of application
- Incident hotspots for IIT KENT can be viewed only when ‘include CPD data’ is checked, because IIT KENT is one building and all incidents reported to IIT Public Safety occurred in the building, not in the surrounding area, so density map can not be plotted
- Time filter can be applied only for prediction
Application available here
Conclusion and Future Improvements
The results of our studies were very useful in terms of identifying the crime hotspots within and around the campus, and identify the possible correlations of incidents with respect to time, weather and location for predicting the locations for serious incidents in future. The location and time proved to be the most important indicators for prediction of serious crimes, and weather does not seem to play an important role considering the evidence at hand. The final standardized dataset and the analysis results should be extremely useful for IIT public safety to identify the areas of potential crime and effectively allocate their officers.
The future improvements for the study would be the following : A Standardardized dataset for logging, extraction and querying of incident data would be extremely helpful for future prediction modelling and studies. A Dashboard could be planned to be maintained for tracking the effectiveness of predictive modelling and corrective actions of public safety Adding new data points to the incident data like victim gender, and age would be beneficial for pursuing other crime related research questions. Currently, we have employed binary classification of incident types for simplicity of model building. Future studies should include Multi-class classification for incident types to add more granularity to the prediction of incidents. Extending the research to other university campuses in Chicago area to understand how the prediction accuracy of model varies across various campus locations.
References
Chicago Data Portal. Crimes - 2001 to present | City of Chicago | Data Portal. (n.d.). Retrieved from [https://data.cityofchicago.org/Public-Safety/Crimes-2001-to-present/ijzp-q8t2] (https://data.cityofchicago.org/Public-Safety/Crimes-2001-to-present/ijzp-q8t2)
Github. Mikhailry/campus_safety. (n.d.). Retrieved from https://github.com/Mikhailry/campus_safety.git
Rose Package. (2015). Retrieved from https://cran.r-project.org/web/packages/ROSE/ROSE.pdf
Shinyapps. Mikhailry. (n.d). Retreived from https://mikhailry.shinyapps.io/CampusSafety/
Weather Underground API. (n.d.). Retrieved from https://www.wunderground.com/weather/api/
Weather Underground R API. (n.d.). Retrieved from https://cran.r-project.org/web/packages/rwunderground/README.html