Travel app
Introduction
People generally feel that booking of flight ticket should be done as earlier as possible to get the best deal. But does booking flight tickets earlier always yield the cheapest price? Or is there a specific day of the week to book a flight or to travel on that minimizes the price of the tickets? To answer these question we’ve setup a data pipeline to retrieve and store flight price data in a structured format in Cosmos DB [1]. In our analysis, we derive insights about the trends in flight prices, the cheapest day and part of the day to travel and compare our results with the study done by ‘Hopper.com’ [2]. Secondly, we create a vacation recommendation engine, by using flight data collected and combining it with points of interest data in those specific locations to inspire a person for the next travel.
Project objectives
First, answer the following questions that will help travellers to optimize their expenditures when booking the flight tickets:
- Does booking flight tickets earlier always yield the cheapest price? Or is there a specific day of the week where the prices are lower?
- When is the cheapest day of the week for travelling by plane on a specific route?
- What is the cheapest day-part to travel, i.e. morning, afternoon or night?
Second, help the travellers to plan a vacation and get inspiring recommendations when you have only a budget you want to spend, origin airport and a month of travel at hand.
Plan of Work
- Set recurring job with Azure Logic Apps [3] to obtain price for flight tickets from ORD (Chicago O’Hare) on 4 destinations: DEN, NYC (EWR, JFK, LGA), LAX, MIA. Prices obtained twice a day at midnight and noon from 1st November, 2018 to 20th November, 2018.
- Collect data for the flights planned for two weeks in December: 12/02/2018 - 12/08/2018 and 12/23/2018 - 12/29/2018.
- Parse response data and add it to NoSQL database (Cosmos DB).
- Set a job with Azure Logic Apps to run ‘inspiration search’ for roundtrip flight tickets, in other words, to obtain a price-map of roundtrip flight tickets from origin to different destinations for a specific months.
- Obtain data on points of interest for various destinations with Triposo API [4] and add it to a different collection of NoSQL database.
- Set the connection between Tableau[5] and Cosmos DB.
- Perform data exploration and analysis to answer questions for the first objective of the project.
- Build an interactive Tableau dashboard of price-map from inspiration flight tickets search.
- Show recommendations of things to do based on the user’s choice of destination and interests.
Literature Review
Analyzing flight prices to determine if there is a particular pattern that airlines follow while announcing the airfares for different routes is the first objective of this project. Referring to the various sources from the citation it is clear that there is a variety of responses.
Aric Jenkins from Money says that data from Hopper, an airfare forecasting company, indicates that on average a customer who books a ticket on Tuesday exactly at midnight saves on average 6% or $18 on tickets. This effect however applies to only 1.6% of the domestic flights that are booked on Tuesday at midnight according to a report by Bloomberg. Hopper also claims that after analyzing the data, Thursday is the best bet for lowering costs on both international and domestic flight. Domestic flights dropped by $12-$15 on average and international flights saw a saving of around $20. Hopper finally concluded that Sunday is the most expensive day to book tickets on.
Brianna Mills from Alternate Airlines[6] says that, the truths that travel bloggers swear to that Tuesdays are the cheapest to book flight tickets or that the best time to book tickets is 6 weeks before your travel date are like mirages in the desert which do not really exist. She goes on to say that people pay less per flight bookings on Thursdays and Friday and pay more on Saturdays and Sundays. In conclusion, prices of flights depends on when you travel rather than when you book.
Dara Continenza from Southern Living[7] concurs with Aric Jenkins as she references Hoppers analysis of the flight prices.
Rick Seaney in his blog[8] makes multiple conjectures such as, domestic flights tickets are best priced at 3PM eastern time on Tuesdays, domestic flight tickets bought in a window of 3 month to 30 days before the departure are best priced, international flight tickets should be booked between 5 and a half months to one and a half months before departure dates.
Tools used
- Cosmos DB is a globally distributed and horizontally scaled database system which ensures high-availability and low-latency capabilities and consistency which can be user defined or chosen from preset options. Low-latency capabilities are crucial in delivering the recommendations in real-time.
- Logic Apps is an Azure cloud service to automate task execution, building workflows and making connections between a variety of applications to trigger execution on events, access and process data, store it. Logic apps are easy to use, has a drag-and-drop interface and highly customizable with user defined functions.
- Tableau is a visualization tool that allows users to create interactive dashboards to portray a story using data. The data fed into tableau could be from different databases including Cosmos DB.
- Python[10] is an interpreted high-level programming language for general purpose programming.
Data Pipeline
A data pipeline was set-up using the Logic App in the Azure environment to recurrently collect the responses from the ‘lowfare’ endpoint of Amadeus API[12]. The recurrent job was set to retrieve the data twice a day, at 12AM and 12PM (figure 1). This recurrent job ran everyday from 1st November, 2018 to 20th November, 2018 as there was a limit to the number of API calls which could be made.
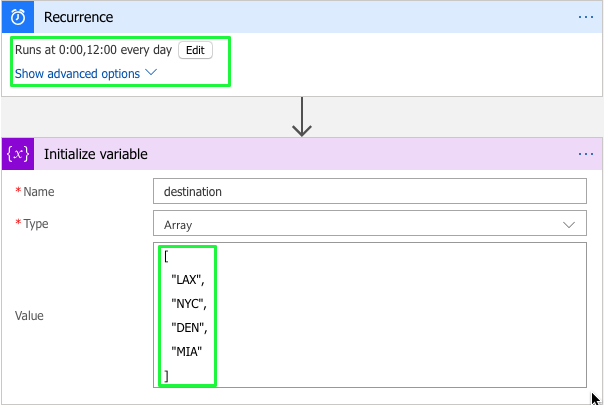
The inputs to the ‘lowfare’ endpoint included the origin (IATA code[13]) from where a customer wants to travel, the travel destination (IATA code), the dates for travel (departure date), nonstop flight (true or false) and number of results. For this project, the origin was set to ORD, the destination was an array of 4 locations, namely, LAX, NYC, DEN, MIA. These destinations were chosen as they represent locations that are known for specific types of vacation, namely, vacation with kids, cultural vacation, skiing vacation, sun and sand vacation respectively. The dates of travel were set to an array of dates which ranged from 12/02/2018 to 12/08/2018 and also from 12/23/2018 to 12/29/2018. The two ranges were chosen to capture the prices during peak season (Christmas) and off season for travel.
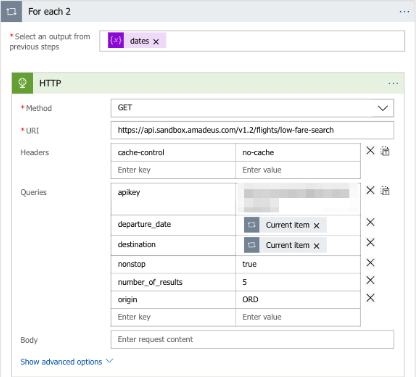
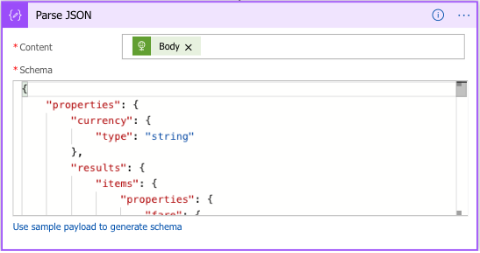
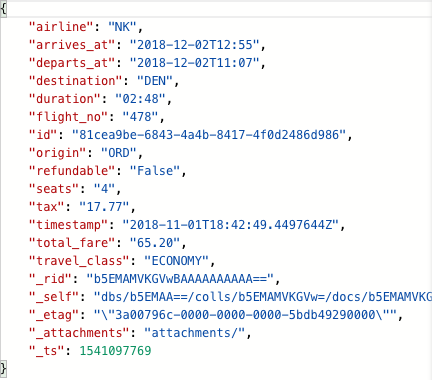
The destinations and travel dates are initialized and passed into a nested loop which calls the ‘lowfare’ endpoint with inputs for all combinations of destinations and travel dates along with other constant input parameters such as nonstop, origin and number of results (figure 2). The response from the API is then parsed with manually defined schema in JSON format (figure 3). Data required to answer research questions is then extracted and stored in the collection in Cosmos DB (figure 4). The observations were stored in the collection as documents, which are similar to JSON format files and consisted of the following attributes, ‘airline’, ‘arrives_at’, ‘departs_at’, ‘destination’, ‘duration’, ‘flight_no’, ‘id’, ‘origin’, ‘refundable’, ‘seats’ (number of seats remaining), ‘tax’, ‘timestamp’ (booking time), ‘total_fare’ and ‘travel_class’. Additional attributes are created for each document by default, such as, ‘_rid’, ‘_self’, ‘_etag’, ‘_attachements’ and ‘_ts’. This collection is connected to Tableau using an ODBC driver[12], to perform analysis and derive insights to answer the research questions.
Inspiration Search
In order to help customers to choose a travel destination, given the type of vacation one is looking for, a month of travel and a budget available, a dashboard to aid in the decision making process was created. Data is aggregated from four different sources, preprocessed and visualized with the Tableau dashboard. First, the inspiration search endpoint of Amadeus API was used to retrieve data on the travel destinations, along with details of the flight price and departure date. A job was set up in the Microsoft Azure’s logic app to retrieve required data. The inputs for the API were, the origin (IATA code), single departure date or a range of departure dates, and whether it’s a direct flight or not. The origin was set to “CHI”. The range of dates which were chosen spanned across each of the months from December, 2018 to May, 2019. The Logic app was programmed in a similar way as the data pipeline stage (explained in the previous section), the difference being that the Logic app did not need to run recurrently. The responses from the API were parsed to JSON format and stored as documents in a collection in Cosmos DB. The attributes of each document were, ‘airline’, ‘departure_date’, ‘destination’, ‘id’, ‘origin’, ‘price’, ‘return_date’. Additional attributes are created for each document by default, such as, ‘_rid’, ‘_self’, ‘_etag’, ‘_attachements’ and ‘_ts’.
This data was extracted from the database and combined with the another data source, which contained the IATA code, city name, country name, latitude and longitude of the airport, using python. In order to retrieve the points of interest of a particular city the ‘POI’ endpoint of Triposo API was used. However, the points of interest could not be retrieved directly using the city name. One of the input field for the ‘POI’ endpoint was location_id. This was a special field specific to the Triposo API. Location_id was obtained with ‘location’ endpoint with the inputs: city name prepended by the string “trigram:” (ex. “trigram:Dallas”), trigram value (>=0.7) and the fields to be retrieved in the response (name, country_id, coordinates, parent_id, type, id). Retrieved details also required preprocessing, as there were multiple cities with the same name in different states and countries (ex. San Jose, California and San Jose del Cabo, Mexico). To ensure that the correct location_id corresponding to the city of the destination airport was retrieved, the distance between two points was calculated with formula[14], where ‘x’ and ‘y’ the latitude and longitude respectively:
sqrt((x1-x2)^2+(y1-y2)^2)
The two points under consideration were, the latitude and longitude of the city retrieved from the ‘location’ endpoint and, the latitude and longitude of the airport. The value of location_id which had the minimum distance between the city center and airport was chosen. These location_ids were used as input to the ‘POI’ endpoint along with tag_labels which represent the type of vacation one wants to go on. Vacation for the kids are represented with ‘zoos, watersports, wildlife, exploringnature, character-Kid_friendly, camping, beaches, amusementparks’. The cultural vacation is represented with ‘architecture, hoponhopoff, museums, sightseeing, showstheatresandmusic, walkingtours’ tags. Sports/adventure vacation are associated with ‘adrenaline, diving, fishing, hiking, hunting, kayaking, rafting, sailing, surfing, wintersport, watersports, sports’ tags. Finally, a romantic vacation consists of places with ‘wineries, character-Romantic, feature-Live_music, cuisine-Fine_dining‘ tags. The response of the ‘POI’ endpoint contained the names of the points of interest (attraction) for that city, a short the description of the place, and the location_id. All the data was combined using multiple joins. The final data contained the following variables, ‘Attraction’ (point of interest), ‘snippet’ (short description of the attraction), ‘category’ (kids, culture, sports/adventure, romantic), ‘city’, ‘country’, ‘departure date’, ‘departure day’ , ‘departure month’ , ‘departure year’ (all three extracted from departure date), ‘latitude’, ‘longitude’, ‘price’ (flight price), among other variables. This combined data was finally uploaded back in Cosmos DB and this collection was connected to Tableau using an ODBC driver. An interactive visualization was created on Tableau to help customers in their decision making process.
Results
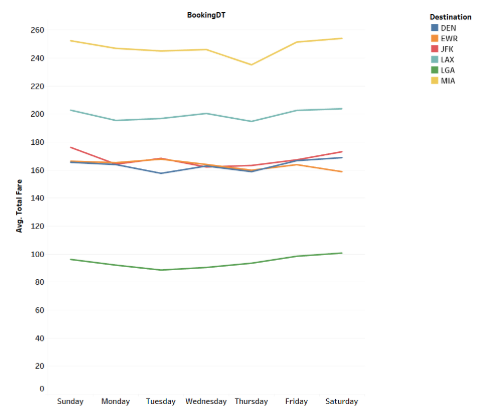
- Analysis of the average flight prices for different destinations based on the day of booking shows that, in general, it is cheaper to book a flight ticket on Thursday (figure 5). This aligns with the research results conducted by ‘Hooper.com’.
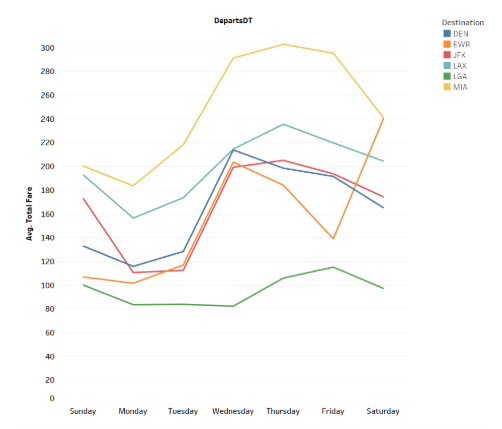
- It is observed from the average flight prices for different destinations based on the day of departure that it is cheaper to fly on Monday.
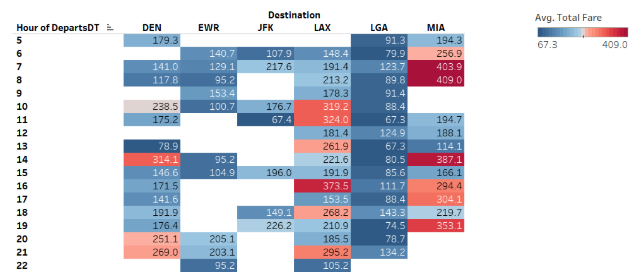
- There are no trends identified in the analysis of the average flight prices to different destinations based on the hour of departure, so we can not reach a conclusion about the best time to fly during the day.
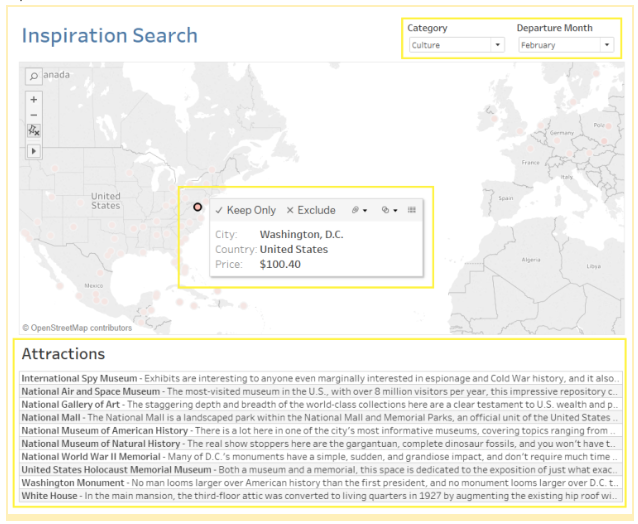
- The Inspiration Search dashboard consists of four main components, i.e., category of vacation a customer wants to take, the month of travel, flight ticket price indicator to various cities across the world, and a pop up attractions table, which contains the name of the attraction and a short description of the attraction.
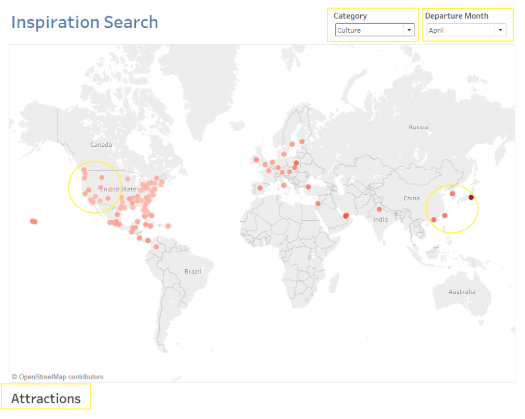
- When a user has decided on the type of vacation and chose a location on the map based on the price of flight tickets, the dashboard automatically updates to display the top attractions for the destination.
Appendix
Flight price analytics dashboard
References
- “Azure Cosmos DB – Globally Distributed Database Service, Microsoft Azure.” – Globally Distributed Database Service, Microsoft Azure, azure.microsoft.com/en-us/services/cosmos-db/.
- Jenkins, Aric. “Cheap Flights: Tuesday Not the Best Day to Buy Plane Tickets, Money.” Time, Time, 5 July 2017, time.com/money/4845914/tuesday-not-cheapest-day-to-buy-plane-tickets/
- “Enterprise Integration with Azure Logic Apps.” Enterprise Integration with Azure Logic Apps, Microsoft Docs, docs.microsoft.com/en-us/azure/logic-apps/logic-apps-overview
- “Smart Travel Content.” Triposo, www.triposo.com/api/.
- “Tableau.” Tableau Software, www.tableau.com/support/help.
- Mills, Brianna. “Is There a Cheapest Day to Buy Flights?” Travel Hacks: The Cheapest Day to Buy Flights, 19 Apr. 2018, www.alternativeairlines.com/blog/cheapest-day-to-buy-flights
- Continenza, Dara. “This Is the Cheapest Time of Day to Book a Flight.” Southern Living, www.southernliving.com/travel/cheapest-time-of-day-to-book-a-flight
- Seaney, Rick. “Cheapest Days to Fly and Best Time to Buy Airline Tickets.” FareCompare, 12 Mar. 2018, www.farecompare.com/travel-advice/tips-from-air-travel-insiders/
- Ekstein, Nikki. “Why You Shouldn’t Wait Until Tuesday to Buy Plane Tickets.” Bloomberg.com, Bloomberg, 5 July 2017, www.bloomberg.com/news/articles/2017-07-05/why-you-shouldn-t-wait-unti-tuesday-to-buy-plane-tickets
- Docs.python.org. (2018). The Python Language Reference — Python 2.7.15 documentation. [online] Available at: https://docs.python.org/2/reference/index.html [Accessed 1 Dec. 2018].
- Visualize Cosmos DB Data in Tableau. (n.d.). Retrieved from https://www.cdata.com/kb/tech/cosmosdb-odbc-tableau.rst In‑text: (“Visualize Cosmos DB Data in Tableau,” n.d.)
- Amadeus Travel Innovation Sandbox, API Catalog. (n.d.). Retrieved from https://sandbox.amadeus.com/api-catalog
- IATA airport code. (2018, November 28). Retrieved from https://en.wikipedia.org/wiki/IATA_airport_code
- Distance Between Two Points, Maths First, Institute of Fundamental Sciences, Massey University. (n.d.). Retrieved from http://mathsfirst.massey.ac.nz/Algebra/PythagorasTheorem/pythapp.htm