Truck maintenance
Project objectives
The truck company operates their trucks in three regions. The regulations require the company to maintain the trucks in good operating conditions. At the same time, the company wants to minimize the downtime due to taking the trucks offline for maintenance by improving business rules that help to determine if a truck is due for maintenance.
By existing rules, a truck is taken offline for maintenance according to the region it belongs to. A truck in Region 1 is maintained once every five days. A truck in Region 2 is maintained once every three days. A truck in Region 3 is maintained once every fifty days. This maintenance schedule is equivalent to this business rule.
| Region | Probability that Maintenance_flag = 1 |
|---|---|
| 1 | 1/5 |
| 2 | 1/3 |
| 3 | 1/50 |
When applying this model to the testing partition, we obtained the following model metrics:
- Area Under Curve = 0.60587637
- Root Average Squared Error = 0.39477599
- Misclassification Rate = 0.28880676 (the threshold value is 0.20469083)
The Receiver Operating Characteristic curve for the testing partition is:

The objective is to develop a new model for each region which collectively reduces the misclassification rate for the testing partition further. Secondary objective is to neither decrease the Area Under Curve nor increase the Root Average Squared Error.
The model building strategy
- Feature selection was done for each of the regions before fitting the models (described in more details in corresponding section below;
- Decision tree, Gradient Boosting Classifier and Logistic Regression were fitted for each region train data (Logistic regression was excluded from the final report, as it has not converged for region 3 and obtained performance metrics were a bit worse compared to other models);
- Predicted probabilities for test data per region obtained from each of the model;
- Predicted probabilities then stacked together for all three regions model type wise (e.g concatenated probabilities of ‘Decision tree region 1’, ‘Decision tree region 2’, ‘Decision tree region 3’, same for Gradient Boosting Classifier) and in a mixed combination – Ensemble 1 (e.g. ‘Decision tree region 1’, ‘Decision tree region 2’, ‘Gradient Boosting Classifier region 3’);
- Models for individual regions and combinations for all the regions were assessed for misclassification rate, RASE and AUC using test data;
- Final model ‘Decision Tree’ for all three regions chosen (more details in corresponding section of the report).
Feature selection
For variable selection we utilize the ‘ExtraTreesClassifier’, to define scores of variable importance and choose only variables that contribute to the goodness of fit.
Extra Trees Classifier fits a number of randomized decision trees on various sub-samples of the dataset and uses averaging to improve the predictive accuracy and control over-fitting. Feature importance is extracted from the fitted model and cutoff is made. It is seen from the table below, that only first variable is substantially more important than others, difference between others is quite small.
Variable importance for region 3 (first 8 variables in descending order of importance):

It is similar for regions 1 and 2. A cutoff of 0.05 was chosen, though further investigation may be required, including the domain knowledge of the experts in the maintenance of the trucks.
With the chosen cutoff, the following variables chosen per region:
- Region 1: ‘Trip_Distance’, ‘Vehicle_speed_sensor’, ‘Trip_Time_journey’, ‘Engine_RPM’, ‘Speed_OBD’, ‘GPS_Altitude’;
- Region 2: ‘Trip_Time_journey’, ‘Trip_Distance’, ‘GPS_Bearing’;
- Region 3: ‘Intake_Air_Temp’, ‘Litres_Per_100km_Inst’, ‘Trip_Distance’, ‘Engine_Coolant_Temp’, ‘GPS_Latitude’, ‘Engine_RPM’;
Model comparison and ROC
Existing model vs Decision Tree for each region:

Existing model vs Gradient Boosting Classifier for each region:

Existing model vs Proposed models:

Even though Gradient Boosting classifier gives the best performance based on the metrics defined in the objective of the project, a Decision Tree model for each region is recommended. It has slightly higher misclassification rate of 0.123 but has much higher interpretability (decision trees plotted above can be used for that). As a further improvement, it is advised to incorporate domain knowledge in the variable selection process. Also, fine-tuning of decision trees may be required.
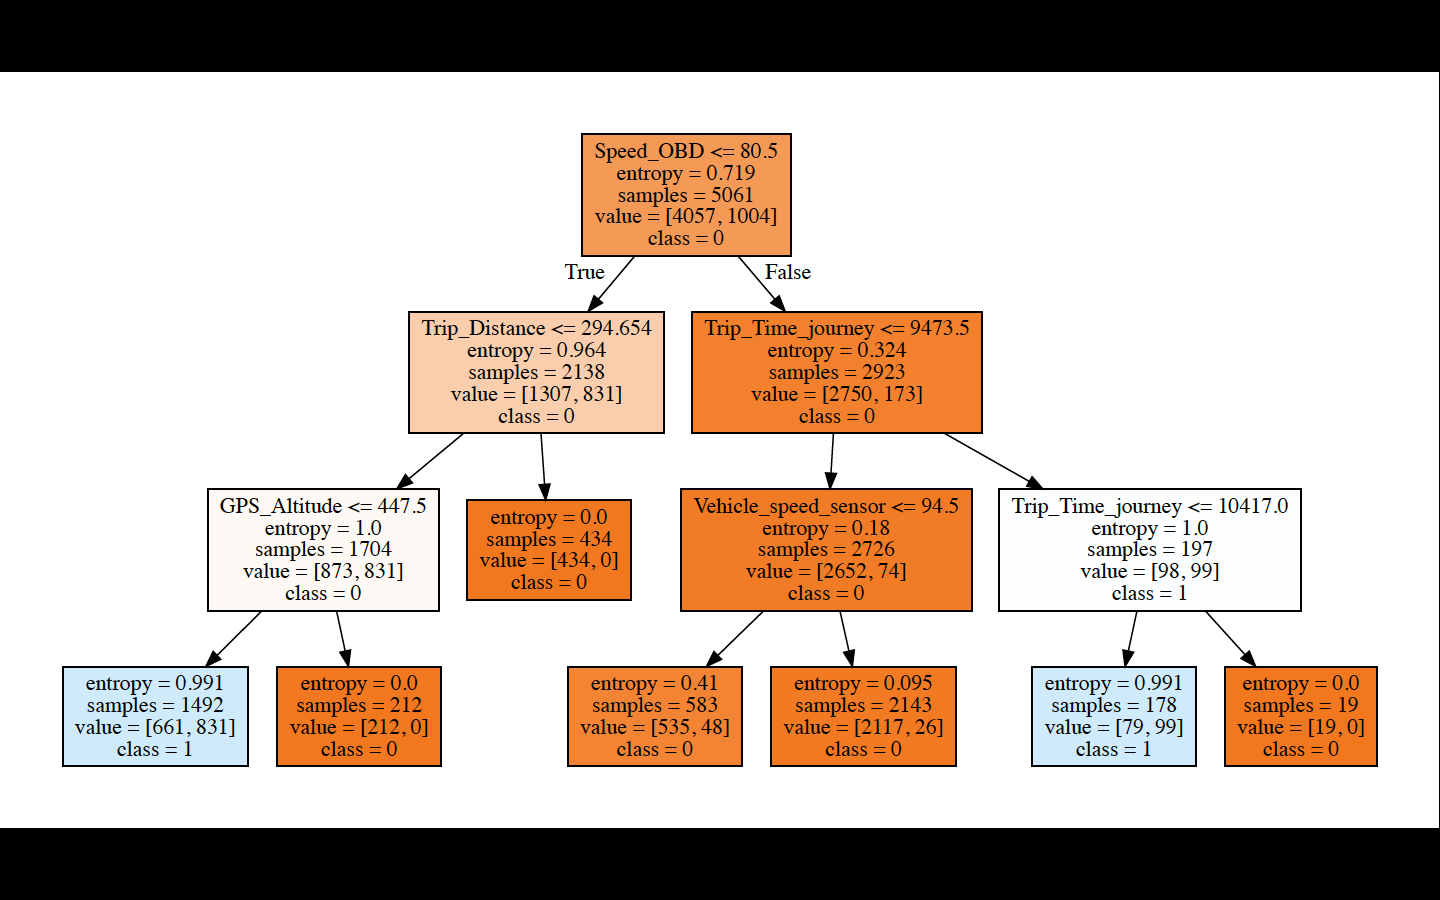
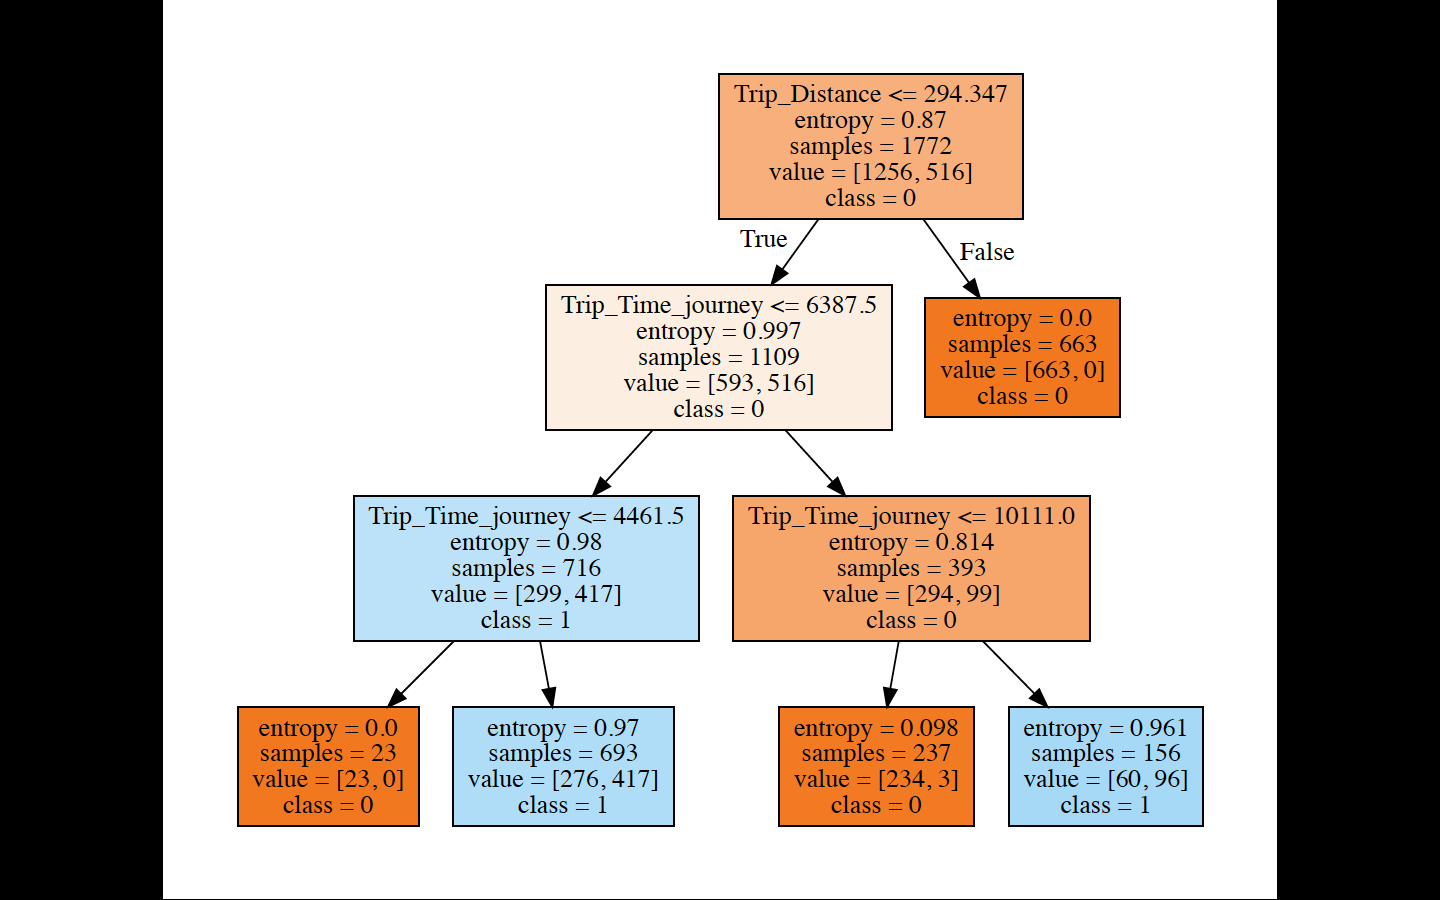
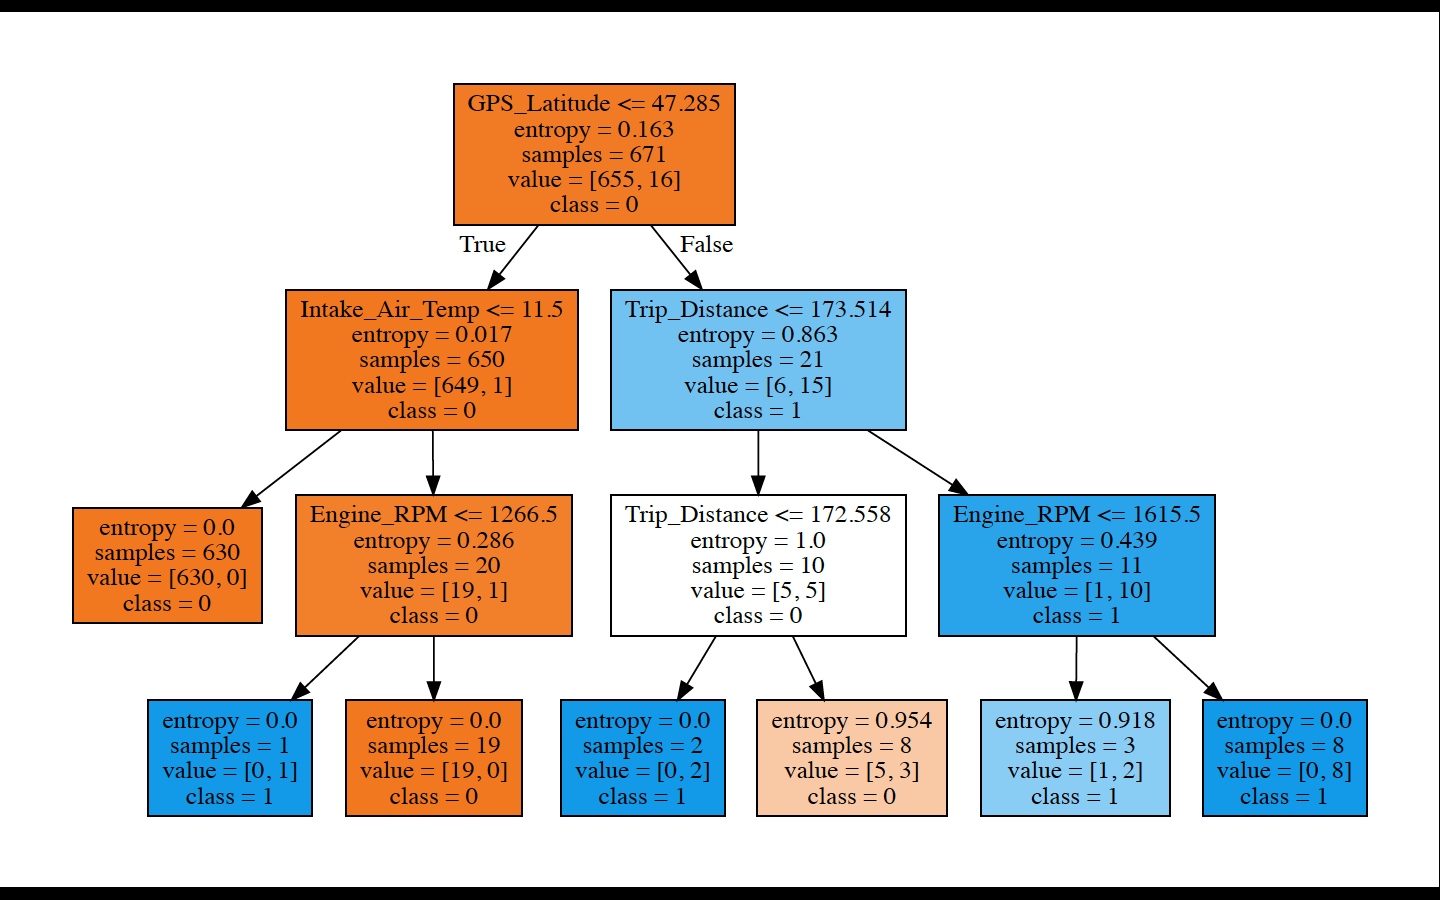
Developed model specification and diagrams for each region
Fitted Decision tree (region 1) specification: DecisionTreeClassifier(class_weight=None, criterion=’entropy’, max_depth=3, max_features=None, max_leaf_nodes=None, min_impurity_decrease=0.0, min_impurity_split=None, min_samples_leaf=1, min_samples_split=2, min_weight_fraction_leaf=0.0, presort=False, random_state=20181204, splitter=’best’)
Specifications for other regions are available in the code.
ROC for developed models:
